Apparently, Grandpa could afford a house on one wage because he didn’t waste his money on iced lattes, avocado toast, mobile phones, Netflix and takeaway deliveries.
Grandma cooked everything from scratch, made do with what she had, and certainly wasn’t popping out for brunch.
And young people today? Apparently they’re living like rock stars on ordinary wages, then complaining they can’t afford the rent.
The conclusion, delivered with considerable certainty, is:
“It’s not the economy — it’s the lifestyle.”
Really?
Now, I’m a grandma myself. I remember the 1970s rather well, thank you. We didn’t have mobile phones, streaming subscriptions or food delivery apps.
Of course we didn’t. They hadn’t been invented yet.
And Grandma cooked from scratch because there weren’t nearly as many alternatives. Convenience foods, modern appliances and services have changed how households operate.
I remember getting down on my hands and knees to polish my mother’s floors with wax and a brush. And washing day, with one of those big round washing machines and a wringer on top, could take most of Sunday. Things were harder back then.
Do I want to go back to that? Not particularly, thank you.
And let’s not forget something else about Grandma. She cooked, cleaned, raised children, managed the household, mended clothes and somehow kept everything going.
Quite right that she gets some credit for it. But all that unpaid work helped make the one-wage household possible.
Grandpa wasn’t necessarily doing it all on his own.
And plenty of grandmas worked outside the home as well.
So perhaps we shouldn’t congratulate previous generations too enthusiastically for doing without things that weren’t available, or overlook the work that went into keeping those households running.
Times change. That’s rather what time does.
But let’s give Grandpa his due.
He probably worked hard. Grandma stretched the household budget, and they made things last. People often went without things we take for granted today.
I’m not disputing any of that.
What I’m questioning is the suggestion that young people can’t afford homes because they’re not as hardworking or disciplined as their grandparents.
Because there’s something rather important missing from this little sermon.
The price of the house.
Meet Grandpa Jack.
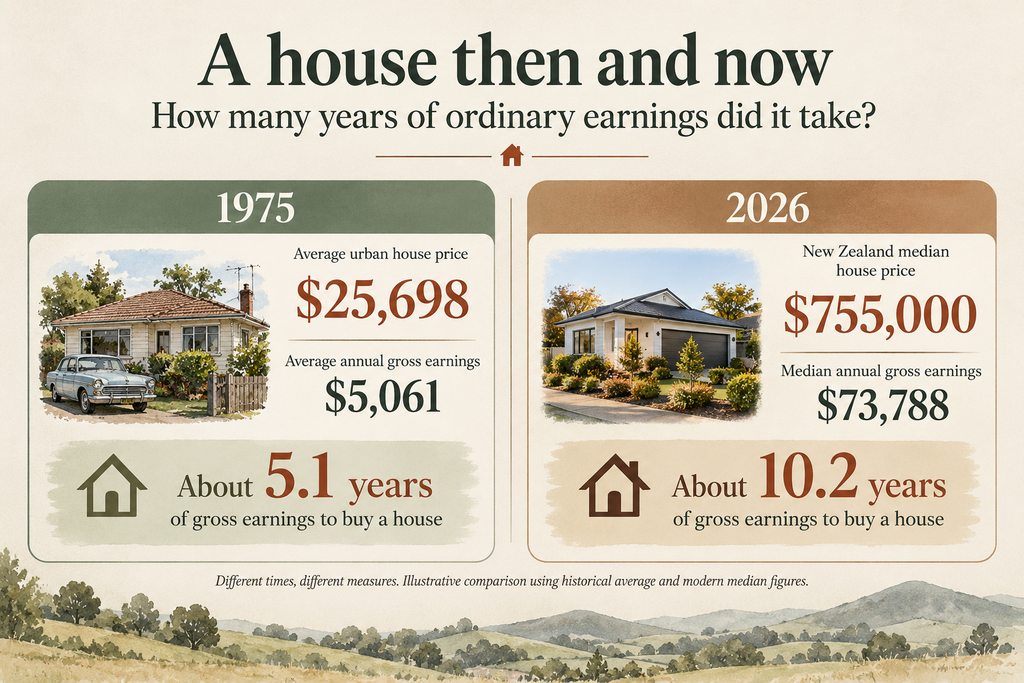
It’s 1975. Jack is an ordinary New Zealander earning an ordinary wage.
He earns about $5,061 a year, and the average existing urban house costs $25,698. That’s roughly five years of his gross earnings.
Now meet his grandchild, Sam.
It’s 2026. Sam earns the median weekly wage or salary income of $1,419 — about $73,788 a year. The median New Zealand house sells for $755,000. That’s more than ten years of gross earnings.
Different times, different measures, but that’s quite a gap, isn’t it?
And Sam hasn’t bought a single avocado.
Now, before someone reminds me that Grandpa paid higher mortgage interest, yes, he did. In 1975, mortgage interest was around 9.65%, and repayments on an average house, assuming a 20% deposit, could swallow more than 40% of an ordinary gross wage.
Hardly a walk in the park.
But the purchase price relative to earnings was considerably lower, and that matters. It affects the deposit you need, how long you must save for it, and how much you have to borrow. And while you’re saving, you’re probably paying rent.
Funny how that little detail gets overlooked.
But young people have so many luxuries!
Yes, they have things Grandpa never dreamed of. Smartphones, computers, internet connections and all sorts of modern conveniences.
But try applying for a job, running a business, studying, banking or dealing with government departments today without internet access.
A mobile phone isn’t automatically a luxury simply because Grandpa didn’t have one.
And let’s not pretend previous generations never spent money on themselves.
People went to the pub. They smoked. They bought cars, boats and caravans. They went on holidays and enjoyed themselves. Some were careful with money. Some weren’t.
Rather like people today, come to think of it.
Now, let’s talk about wages.
In New Zealand today, someone working 40 hours a week on the adult minimum wage earns $49,816 a year before tax.
The median house price is $755,000.
That’s more than fifteen years of their entire gross earnings.
And before they can even think about buying a house, they need a deposit and a bank willing to lend them the rest.
Of course, that’s assuming they can find a full-time job paying enough to live on in the first place.
Apparently, that’s another small detail we’re supposed to overlook.
So perhaps the problem isn’t simply that young people aren’t saving enough.
Perhaps we should ask whether ordinary wages still provide a realistic pathway to owning an ordinary home.
Personal responsibility? Of course.
I’m all for people living within their means. If you’re spending hundreds of dollars every month on things you don’t need, perhaps you should take another look at your budget. That’s sensible advice, whatever your age.
But there’s a considerable difference between encouraging people to manage their money carefully and blaming an entire generation’s housing difficulties on frivolous spending.
One is common sense.
The other needs evidence.
And the evidence tells us that house prices have risen substantially relative to ordinary earnings. That doesn’t mean Grandpa had it easy, or that every young person is struggling.
It means circumstances have changed.
So, about that avocado toast…
Perhaps Grandpa made his own coffee, drove an old car and lived within his means. Good for him!
But perhaps he also lived in an economy where an ordinary wage could buy considerably more house than it can today.
And perhaps his grandchildren aren’t all irresponsible spendthrifts simply because they have smartphones and occasionally buy themselves a coffee.
Before we lecture them about their lifestyles, shouldn’t we at least acknowledge the difference?
Because you can give up every latte, cancel Netflix and eat baked beans for dinner.
It still doesn’t change the price of the house.
Granny Asks.
Check Granny’s homework
I don’t expect you to take Granny’s word for it. These are the main sources behind the questions I’ve asked here.
There I was, minding my own business — well, as much as Granny ever does — when Labour’s Kieran McAnulty popped up in my social media feed giving the Government a fairly enthusiastic serve.
He was speaking during the third reading of the Appropriation (2026/27 Estimates) Bill.
National, he argued, had promised New Zealanders lower taxes, disciplined government spending, less debt and balanced books — but the arithmetic wasn’t adding up.
Now, political speeches are rather like supermarket specials. The large print gets your attention. Granny likes to check the unit price.
So out came the calculator.
And, for reasons that will become apparent, six eggs.
Granny’s six eggs
Suppose Granny has six eggs.
I can eat them. Sell them. Give some away. Save them for later.
I can even borrow some eggs from the neighbour, although that introduces an entirely different conversation about interest rates and why the neighbour now owns part of my omelette.
Or I can invest in more chickens and hope they produce more eggs in future.
But there is one thing I cannot do.
I cannot promise the same six eggs to seven different people and pretend the missing egg doesn’t matter.
Governments have more sophisticated tools than Granny’s egg basket, but the basic problem remains.
They can collect more revenue. Borrow. Spend less. Move spending from one place to another. Invest in things that might grow the economy and therefore produce more revenue later.
But when you promise lower taxes, more or protected spending in important areas, lower debt and balanced books, eventually the eggs have to come from somewhere.
So: did Kieran have a point?
Mostly.
But there are some important wrinkles.
What did National actually promise?
Before the 2023 election, National’s fiscal plan used a very tidy little phrase:
“Disciplined spending, lower taxes, less debt.”
It also forecast a return to surplus in 2026/27 and debt $3.4 billion lower in 2027/28 than the PREFU forecast.
National said it would work towards returning core Crown expenditure to around 30 percent of GDP over time, while increasing spending on health and education and finding savings elsewhere.
That’s important.
National didn’t simply promise to slash everything.
It promised to make the numbers work.
So let’s check them.
Lower taxes — yes. But for whom?
National did deliver personal income-tax relief.
The income-tax thresholds changed from 31 July 2024, and Treasury estimated that most households would receive something from the wider tax package.
But the average weekly gain wasn’t evenly distributed.
Treasury’s estimates by household-income quintile were roughly:
$13, $24, $32, $38 and $39 a week, moving from the lowest-income fifth of households to the highest.
There were targeted measures as well, including changes to the In-Work Tax Credit and FamilyBoost, so it would be unfair to pretend the whole package simply handed money to the wealthy.
It didn’t.
But it is equally fair to ask:
Who received the largest dollar benefit — and who needed every dollar most?
National also restored full mortgage-interest deductibility for residential property investors from April 2025.
Again, that is a policy choice.
And it reminds us that tax policy isn’t merely about whether taxes go up or down.
It is also about who the Government chooses to collect the money from — and who it chooses not to.
Did the Government actually spend less?
Here we encounter one of politics’ favourite tricks.
The ruler.
Core Crown expenses were about $127.6 billion in 2023, $139 billion in 2024 and $141.7 billion in 2025. Budget 2026 forecast about $147.2 billion for 2026.
So in actual dollars, Government spending increased.
But measured as a share of GDP, the story looks different.
Core Crown expenses were around 33.6 percent of GDP in 2024 and about 32.6 percent in 2025, with a similar percentage forecast for 2026.
So National can reasonably say it has restrained spending relative to the size of the economy.
And Labour can reasonably point out that the Government is still spending more dollars.
Both statements can be true.
Imagine the farm.
If our expenses rise from $80,000 to $90,000 while farm income rises from $200,000 to $250,000, our spending has increased by $10,000.
But it has fallen from 40 percent to 36 percent of our income.
Did spending go up?
Yes.
Did spending fall?
As a proportion of income, also yes.
Welcome to politics.
This is why Granny has acquired a new rule:
Never ask simply, “Did it go up or down?”
Ask:
What measure? Compared with what? Over what period?
Two ledgers
And this brings me to something rather more important.
And between them sits the economy — businesses, wages, investment, construction and growth.
They are connected.
But they are not the same thing.
Fiscal ratios matter. Governments have to pay their bills.
But fiscal ratios don’t house and feed people.
They don’t put dinner on the table.
They don’t build the house.
And they don’t give somebody a job.
So whenever a Government tells us an outcome has improved, perhaps we should ask whether the thing being measured is actually the outcome people experience.
The spreadsheet isn’t wrong. It just isn’t the whole story.
What happened to “less debt”?
This one is harder to wriggle around.
Net core Crown debt was about $182.2 billion in 2025, or around 41.9 percent of GDP.
Budget 2026 forecast it at about:
$191.8 billion in 2026.
$216.5 billion in 2027.
$232.4 billion in 2028.
The debt-to-GDP ratio is forecast to peak at about 46.1 percent before declining.
There is some genuinely better news within that.
The forecast debt peak improved compared with the previous forecast, and by May 2026 net core Crown debt was about $2.8 billion better than Budget forecast for that point.
That deserves acknowledgement.
But:
Reducing a forecast of future borrowing is not the same thing as reducing the debt we already have.
National promised less debt.
The debt stock has increased and is forecast to increase further before it falls.
That isn’t political spin.
That’s the ledger.
And those balanced books?
National’s 2023 fiscal plan forecast a return to surplus in 2026/27.
Budget 2026 now forecasts an OBEGALx deficit of about $11.4 billion in 2026/27, with surplus forecast for 2028/29.
Two fiscal years later.
Perhaps it will happen.
I hope it does.
But forecast chickens lay an awful lot of eggs.
Granny would quite like to count them after they’ve hatched.
Now let’s open the People Ledger
Because if the recipe is working, surely something should eventually appear on the plate.
Jobs
In the June 2026 quarter, unemployment was 5.6 percent, with about 171,000 people unemployed.
Underutilisation — which captures a broader group of people wanting more work — was 13.8 percent.
There are signs of improvement.
Employment increased during the quarter. More than 40,000 new homes were consented in the year to June, up 19 percent on the year before.
So I am not going to tell you nothing is improving.
It is.
The recovery may have started, but a lot of New Zealanders are still waiting for it to reach them.
And that matters when we talk about beneficiaries.
At June 2026, about 218,500 people were receiving Jobseeker Support.
But around 98,000 of them were in the health-condition or disability category.
And of those people subject to benefit obligations, roughly 98 percent were in the Green category under the Traffic Light System.
More than 21,000 people exited benefits into employment during the June quarter — an improvement on the year before.
Good.
We should want more of that.
But it leaves Granny with a fairly basic observation:
You can’t sanction somebody into a job that doesn’t exist.
Food
During the June 2026 quarter, MSD made 542,766 hardship payments worth $176.6 million.
More than 312,000 were Special Needs Grants for food, worth almost $31 million.
Those aren’t 312,000 different hungry families. A person can receive more than one grant.
But food grants were still up on the same quarter a year earlier.
The Government itself acknowledges that demand for food support remains elevated, largely because of continuing cost-of-living pressures, and Budget 2026 provided another $15 million for food-support programmes.
That’s necessary help.
But surely the measure of a successful economy isn’t how efficiently we fund the ambulance at the bottom of the grocery bill.
The goal must be fewer people needing emergency help to eat.
Again:
The spreadsheet isn’t wrong. It just isn’t the whole story.
Housing
Here’s another measurement problem.
The Government has achieved a substantial reduction in households living in emergency housing.
There were 3,141 households in emergency housing in December 2023.
By June 2025, that had fallen to 501.
That’s a significant result.
Through Priority One, more than 1,000 households, including more than 2,200 children, had also been placed into social housing.
Those are real people getting homes.
That deserves a tick.
But:
Emergency housing is a programme. Homelessness is a condition.
Access to emergency housing was tightened in 2024, and MSD’s own policy analysis warned that tightening access before enough alternative housing was available could increase rough sleeping, people living in cars and overcrowding.
Meanwhile, Auckland City Mission reported more than 800 people sleeping rough in Auckland, almost double its September 2024 count.
That doesn’t prove Government policy caused the increase.
It does mean we should be very careful about declaring homelessness solved because one administrative number has fallen.
If far fewer households are in emergency housing, but organisations on the ground are seeing more people sleeping rough, have we solved homelessness — or have we partly changed where we count it?
That’s the Measurement Stick Rule again.
There was never only one recipe
This is where my politics come in.
I lean left.
Not because Labour is always right.
It isn’t.
Not because every public programme works beautifully.
They don’t.
And certainly not because Labour gets to hide its own inconvenient numbers behind a nice red sign.
It doesn’t.
I lean left because I believe government has a responsibility that goes beyond balancing its books.
People need to be housed.
Fed.
Healthy.
Educated.
Able to work.
And given a reasonable chance to build a life.
We have heard repeatedly that New Zealand had to make difficult decisions.
Perhaps we did.
But there was never only one recipe.
There wasn’t.
Governments choose their priorities. And, just as importantly, they choose who is asked to carry the burden of those choices.
A tax cut is a choice.
A public-service cut is a choice.
Restoring mortgage-interest deductibility to landlords is a choice.
Tightening access to support is a choice.
They may be defensible choices.
They may even produce benefits later.
But they are choices — not unavoidable laws of economics.
But was all that pain inevitable?
This is the question I keep coming back to.
National says difficult decisions were necessary to restore fiscal discipline and create the conditions for growth.
Maybe some were.
But were these particular decisions necessary?
Was the disruption to employment and construction unavoidable?
Was squeezing public services the only route?
Was restoring full mortgage-interest deductibility for property investors while other New Zealanders struggled the only sensible allocation of those eggs?
Or were these political choices about where the burden should fall?
Difficult decisions don’t happen in a vacuum.
Governments decide where the difficulty falls.
When someone on a low income is choosing between food, rent and the doctor, a policy decision isn’t merely sitting inside a spreadsheet.
It lands in somebody’s kitchen.
Fiscal responsibility matters. But so does fiscal humanity.
And if we are going to be asked to judge this economic experiment by the recovery it eventually produces, surely we are also entitled to account for the full cost of getting there.
How many jobs were lost?
How many businesses disappeared?
What happened to construction?
What happened to people’s health, housing and ability to feed themselves?
Which services were diminished?
Which costs simply moved from the Government’s ledger onto councils, charities, families and individuals?
And then comes the question I don’t think we ask nearly enough:
Could we have reached the same destination by a less damaging route?
Because the casualties belong in the accounts too.
So, was Kieran right?
Mostly.
National did cut personal income taxes.
Government spending has fallen from its recent peak when measured as a share of GDP.
Emergency-housing numbers have fallen dramatically.
Some fiscal results have come in better than forecast.
And there are early signs that parts of the economy are recovering.
Those things deserve ticks.
But they do not erase the rest of the ledger.
Debt has increased, not decreased.
The surplus National forecast for 2026/27 is now forecast for 2028/29.
Unemployment remains high.
Food hardship remains substantial.
And some of the better outcomes we’re now being promised remain exactly that — promises and forecasts.
We cannot count tomorrow’s recovery as payment for yesterday’s pain until it actually arrives.
There is one part of Kieran’s speech that remains in Granny’s question-mark column.
He said the Government had borrowed more than the previous Labour Government did if COVID borrowing was excluded.
That may turn out to be defensible.
But “borrowing” can mean several different things in Crown accounts, and COVID comparisons depend heavily on the period and measure chosen.
Until I can see the working behind that particular claim, it doesn’t get a tick.
Being broadly right doesn’t give anyone — Labour included — permission to chuck an attractive number into a speech without showing the homework.
But after doing all this homework, I find myself less interested in which politician won the argument than in the choices underneath it.
National didn’t inherit an easy economy.
Something had to be done.
But “something had to be done” doesn’t mean there was only one thing that could be done.
National chose its recipe — and its choices helped determine where the burden would fall.
On public services.
On people who lost jobs.
On beneficiaries facing tighter rules.
On families already struggling with food, housing and healthcare.
At the same time, it chose tax relief and restored full mortgage-interest deductibility for residential property investors.
National will argue those decisions were necessary to restore fiscal discipline and eventually produce growth.
Granny is entitled to look at who was hurting while we waited and say: I don’t think that was the only choice. I don’t think it was a fair one.
And I’m angry.
I’m angry that so much of the burden appears to have fallen on people who had the least room to carry it.
I’m angry that hardship can become another line on a fiscal spreadsheet while we wait for forecasts of better times to come true.
And I’m angry because, after doing all this homework, I still haven’t found evidence that this particular distribution of the pain was inevitable.
Maybe National can make that case.
But “we had to make difficult decisions” isn’t the same thing as proving these were the right decisions — or that the right people were asked to bear them.
Labour is offering another recipe.
Among its proposals are free GP visits and prescriptions, apprenticeship and small-business measures, a New Zealand Future Fund, and a 28 percent capital gains tax on gains made after 1 July 2027 from covered residential investment and commercial property when sold. The family home, farms, KiwiSaver, shares, businesses and inheritances are excluded.
I prefer quite a lot of that because it asks a different question about where the burden should fall. It asks more from some of those who gain from investment property, while putting more into healthcare, skills and the things that help people participate in the economy.
And that isn’t necessarily a one-way transfer from those at the top to those further down. A healthier, better-skilled population with secure jobs and money to spend creates customers, workers, businesses and opportunities. The benefits can travel back up the economic ladder too.
To me, that isn’t simply spending. It is investment in people — and people are part of the economy too.
But preference isn’t proof.
Can Labour raise what it says it will raise? Can it deliver what it promises? What happens to debt and the books along the way?
Labour still gets the calculator.
A different recipe still has to add up.
So the calculator stays on the table.
Who are you collecting the eggs from?
What are you spending them on?
What are you borrowing?
What are you building for tomorrow?
And, perhaps most importantly:
Who is carrying the burden today?
Six eggs.
Two ledgers.
A great many promises.
And somewhere in all those billions, percentages, forecasts and fiscal ratios are actual New Zealanders trying to live their lives.
So before we congratulate anybody on the recipe, Granny has one final question.
Debt, money printing, immigration, government spending — the numbers can be real without the story wrapped around them being quite what it seems. Granny did the homework.
A few weeks ago, I came across one of those long Facebook posts explaining what has gone wrong with New Zealand.
You know the sort. Debt. Government spending. Money printing. Immigration. Too many public servants. Too much waste. Too much of everything, apparently — except common sense.
It got my angry up.
My snide-retort finger was hovering dangerously close to the appropriate button when a rather inconvenient thought occurred to me:
Do I actually know whether all of this is true?
Some of it certainly sounded true. Grocery prices hurt. Rates hurt. Power bills hurt. We run a small farm, so I don’t need a politician or a Facebook page to tell me that household costs have risen. I can see that perfectly well from my own bank account, thank you very much.
But there is a rather large gap between “things are difficult” and “New Zealand is an economic basket case and this is who caused it.”
So instead of reposting it, I went looking.
And the more I looked, the more questions I had.
How bad is New Zealand’s debt, really? What actually happened to government borrowing during Covid? Did we simply “print money”? Is immigration wrecking the country, rescuing it, or — annoyingly — a bit more complicated than either?
And when governments promise to save billions by cutting spending, where does that saving actually come from — and who benefits from the saving?
That Facebook post was supposed to give me answers.
Instead, it gave me homework.
And, as it turns out, quite a few questions for Granny.
Meanwhile, back in the real world…
Before we start arguing about who broke what, perhaps we should acknowledge the bit most New Zealanders don’t need a graph to tell them.
Things are tough.
Food costs more. Electricity costs more. Rates have climbed. Housing is painfully expensive. For many households, wages simply haven’t kept pace with the bills arriving on the kitchen bench.
Jobs are harder to come by. Unemployment has risen to its highest level in more than a decade. Businesses are struggling too, with company liquidations remaining at elevated levels.
And at the same time, the welfare system has become more sanctions-focused, with tighter obligations for people who may already be having considerable difficulty finding work.
That combination bothers me.
If jobs are harder to find and businesses are failing, how much pressure can we reasonably put on someone for not finding a job?
None of this is imaginary, and telling people that some economic indicator is improving doesn’t make the supermarket checkout, the power bill or the prospect of losing a job any less frightening.
Government debt has risen substantially. New Zealand borrowed heavily through the Covid years. The Reserve Bank created large amounts of money through its quantitative easing programme. Net migration surged after the borders reopened, putting additional pressure on housing and infrastructure that were already struggling to keep up.
Those are real things. They deserve scrutiny.
But this is where I started getting fidgety.
A list of individually accurate figures can still create a very misleading story if we leave out the context connecting them.
A true number doesn’t automatically make the story wrapped around it true.
How much of that debt was Covid spending? How unusual is New Zealand’s debt compared with countries like ours? Why was money created, who actually created it, and where did it go? Who were those migrants, why did they come, what did they contribute — and why, at the same time, were so many New Zealanders leaving?
And when a government says it has saved billions of dollars, what was actually cut to produce that saving?
Where did the cost go — and who benefited from the saving?
Because perhaps the most important question is this:
If we agree there are problems, does that automatically mean the proposed cure is the right one?
That’s where Granny’s homework really began.
The debt number that stampeded around Facebook
One of the numbers in the post that started all this was $190.3 billion — Treasury’s net core Crown debt figure at 30 April 2026.
Now, a number as large as $190.3 billion can stampede around Facebook quite impressively. Put it beside the word debt, add a suitably alarming sentence or two, and it sounds as though someone has backed the country up to its credit-card limit and gone shopping.
But what does the number actually mean?
This is where things become rather less exciting — and considerably more useful.
Governments have several ways of measuring debt. Gross debt, net debt and different Treasury measures can all produce different numbers. So before deciding whether a debt figure proves the country is broke, we need to know which debt figure we are talking about.
Then there is the rather important question of size.
A $190 billion debt sounds enormous to a household — because it is. But a national economy isn’t a household. Countries are normally compared by looking at debt relative to the size of their economy, usually as a percentage of GDP.
And when we do that, New Zealand doesn’t suddenly become debt-free or give us permission to stop worrying about borrowing. Debt still matters. Interest has to be paid, and money spent servicing debt can’t be spent somewhere else.
But neither does New Zealand emerge as some uniquely indebted economic disaster.
Then I wondered: where did all that extra debt come from?
Quite a lot of it came from something we seem remarkably good at forgetting when discussing the books — a global pandemic.
The Government borrowed heavily to fund wage subsidies, health measures and support for businesses and households while large parts of normal economic life were effectively switched off.
We can absolutely argue about whether every dollar was well spent. Some clearly wasn’t. We should ask what worked, what was wasteful and what we should do differently next time.
But that’s a different argument from pretending the increase in debt appeared because somebody simply lost control of the chequebook.
There is another little trick worth watching for here.
Debt did not begin with one government, and responsibility for it does not magically stop when the government changes.
Every incoming government inherits an economy, a set of books and decisions made before it. It also starts making decisions of its own.
So fiscal responsibility can’t mean blaming every increase on the people who came before you, while claiming ownership of every improvement that happens on your watch.
That rule should apply whichever party is in government.
The original post also went considerably further than questioning whether public money had been wisely spent, making serious suggestions about where some of that money had gone.
Waste, poor administration and weak accountability absolutely deserve investigation.
But allegations that politicians personally benefited from public money require something rather more substantial than suspicion.
They require evidence.
Economics is not a pantomime, and any post offering us a neat cast of heroes and rogues should make us cautious.
So yes, New Zealand has more debt.
The useful questions are not “Is $190.3 billion a frighteningly large number?”
Of course it is.
The useful questions are:
How much debt do we have relative to our ability to pay it, why did we borrow it, what did we get for it, and what should we do about it now?
Did Labour simply “print money”?
Another claim that crops up regularly is that Labour printed billions of dollars during Covid, flooded the economy with money and caused inflation.
There’s some truth in there. But quite a lot has been squeezed into one sentence.
The money creation was actually part of the Reserve Bank’s Large Scale Asset Purchase programme, New Zealand’s version of quantitative easing. The Reserve Bank created central-bank money and used that money to buy government bonds, helping push interest rates down and support an economy suddenly facing a rather alarming global pandemic.
So, was money created?
Yes.
Was it simply Labour turning on the printing presses to pay its bills?
No.
And was New Zealand alone in doing it?
Not remotely. Central banks around the world took similar extraordinary measures.
That doesn’t mean there were no consequences. Very low interest rates, quantitative easing and enormous government support all played a part in what happened next, alongside global supply shortages, shipping disruption, energy prices and the war in Ukraine.
There are legitimate questions about whether support went too far or lasted too long, and whether some of the money was badly spent.
Those questions deserve proper answers.
But “Labour printed money and caused inflation” takes a complicated series of decisions, made during an extraordinary global event, and turns them into a wonderfully convenient political slogan.
Granny gets suspicious when complicated things become wonderfully convenient.
Did immigration overwhelm New Zealand?
Immigration was another culprit in the original list.
And again, there is a real problem underneath the accusation.
After the borders reopened, net migration rose very rapidly.
But this wasn’t primarily a flood of New Zealanders coming home. In fact, New Zealand citizens were leaving in greater numbers than they were returning.
More people need houses, roads, schools, doctors, electricity and water. If population grows faster than infrastructure can keep up, something has to give.
New Zealand has been particularly good at adding people first and wondering where to put everything else afterwards.
So yes, rapid immigration can put pressure on housing and public services.
But migrants don’t just arrive needing things.
They also work in our hospitals, build houses, teach in our schools, run businesses, pay taxes, harvest crops and fill jobs that employers struggle to fill locally.
That leaves us with a rather more useful question than simply asking whether immigration is good or bad:
Are we planning properly for the number of people we bring in?
If immigration increases the population without matching investment in housing, health, transport and other infrastructure, then the problem isn’t necessarily the people who arrived.
It may be that we invited them in without building enough chairs.
And blaming immigration for every stretched hospital, expensive house or crowded road risks overlooking another awkward possibility:
perhaps some of those systems were already struggling before the new arrivals got here.
Immigration has costs. It also has benefits.
The sensible argument is about how much immigration New Zealand needs, what sort, how quickly our population can grow, and whether governments are prepared to invest in the infrastructure that growth requires.
That’s considerably harder to squeeze onto a Facebook meme.
Does cutting government spending save us money?
This one sounds wonderfully straightforward.
If the Government is spending too much, spend less. Cut waste, reduce bureaucracy, shrink the public service and get the books back under control.
And if something genuinely is wasteful, I’m all for asking why we’re paying for it.
But there’s a question I don’t think we ask often enough:
What happens to the work when we cut the person doing it?
Sometimes the work really can disappear. A programme may no longer be useful. Two departments may be doing much the same thing. Technology may allow something to be done with fewer people.
Fair enough.
But a nurse removed from the public payroll doesn’t remove the sick person.
A planner no longer employed by a council doesn’t make the consent application disappear.
A government department using fewer staff may simply hire consultants or contractors when the same work still needs doing.
And when services become harder to access, the cost doesn’t necessarily vanish either.
It can turn up somewhere else — in longer waiting lists, delayed maintenance, families paying privately, councils picking up responsibilities, or problems becoming more expensive because we waited too long to deal with them.
The ledger may look tidier, but the bill has not vanished. It may simply have slid into another column.
None of this means governments should spend without restraint.
Of course they shouldn’t.
It means that “we cut $X billion from government spending” doesn’t, by itself, tell us whether New Zealand is $X billion better off.
To know that, Granny wants to know something rather more mundane:
What did we stop buying, what happened as a result, and where did the cost go?
So what are the alternatives?
This is where political arguments can become rather limiting.
We are often presented with two choices: keep spending recklessly, or tighten our belts.
But are those really the only choices?
A country can invest in infrastructure that improves productivity. It can train more of the people it needs rather than continually discovering shortages. It can build housing and plan properly for population growth. It can look at whether its tax system raises enough money, and whether that burden is being shared fairly.
It can also ask a question that seems almost embarrassingly obvious:
What are we trying to achieve?
Because balancing the books is important, but a government isn’t a set of books.
If we save money while hospitals become harder to access, houses remain unaffordable, infrastructure deteriorates and families struggle to pay for the basics, have we actually become better off?
Equally, spending more money doesn’t automatically solve those problems. Governments can waste money just as enthusiastically as anybody else.
So perhaps the choice isn’t really spending versus cuts.
Perhaps it is about deciding what New Zealand needs, working out what genuinely improves people’s lives and the country’s long-term prospects, and then being rather more demanding about whether the money we spend actually achieves it.
That might mean spending less in some places.
It might mean investing more in others.
And yes, it might mean having some uncomfortable conversations about tax.
None of those questions has a tidy one-line answer.
But neither does running a country.
New Zealand is not fine
None of this is an argument that everything is fine.
It isn’t.
People are struggling with the cost of living. Housing remains painfully expensive, and the number of New Zealanders recorded as living without shelter rose sharply between the 2018 and 2023 censuses, and more recent evidence suggests it has risen further.
This winter, there have been several reported deaths among people sleeping rough, including a woman found seriously unwell on a Christchurch beach during freezing conditions.
Our health system is under pressure. Infrastructure has been neglected. Productivity is a problem. Government debt is higher, and there are perfectly reasonable questions to ask about how public money has been spent.
We should ask them.
But there is quite a leap from “New Zealand has serious problems” to “New Zealand is broken.”
And an even bigger leap from there to “therefore this particular political prescription is the only responsible way forward.”
That’s the bit that bothers me.
Because once we convince ourselves that the country is broke, that nothing works and that we simply can’t afford the things we once expected a decent society to provide, all sorts of choices begin to look inevitable.
Perhaps they aren’t.
Perhaps some things genuinely do need cutting.
Perhaps some things desperately need investment.
Perhaps taxes need changing. Perhaps spending priorities do. Perhaps governments of both left and right need to get considerably better at showing us what we receive for the money they spend.
Those are arguments worth having.
But I’d quite like us to have them without first frightening ourselves into believing there is only one possible answer.
The Facebook post that started all this gave me a tidy explanation for what had gone wrong with New Zealand.
After doing the homework, I’m rather less certain.
Some of the figures were real. Some of the problems were real. But a true number does not automatically make the story wrapped around it true.
Almost everything I looked at turned out to be considerably more complicated than the Facebook version suggested.
Which, inconveniently, leaves us with questions rather than slogans.
I think that’s probably a good thing.
New Zealand is not fine.
But neither is it beyond fixing.
So perhaps the question heading into this election isn’t simply who do we blame for getting us here?
Perhaps it is:
What kind of New Zealand do we want to build from here — and who do we want it to work for?
Granny’s going to have a few questions about that.
An earlier version of this article was published by Scoop. This version has been substantially revised, expanded and given the full Granny treatment.
Check Granny’s homework
I don’t expect you to take Granny’s word for it. These are the main sources behind the questions I’ve asked here.
MSD — Benefit Fact Sheets, March 2026 MSD recorded 12,582 benefit sanctions in the March 2026 quarter, compared with 7,509 in March 2024. Sanctions can involve benefit reduction, suspension or cancellation.
Companies Office — Latest company statistics There were 710 liquidator appointments in the June 2026 quarter, up from 677 in the same quarter of 2025 and 629 in 2024. This is why Granny talks about liquidations remaining elevated rather than treating every company removal as a business failure.
Treasury — Government financial statements to 30 April 2026 The source of that attention-grabbing $190.3 billion figure: net core Crown debt was $190.3b, or 42.8% of GDP. Treasury also notes that this measure can fluctuate during the year.
Reserve Bank — Money creation in New Zealand Explains who actually creates money and how the Covid-era Large Scale Asset Purchase programme worked. Under LSAP, the Reserve Bank created settlement cash to buy government bonds — rather more complicated than “Labour turned on the printing presses”.
Stats NZ — Net migration falls in 2024 The source behind Granny’s immigration discussion, including the important distinction between migrant arrivals and New Zealand citizens leaving the country.
HUD — Homelessness Insights HUD’s most robust estimate recorded 4,965 people living without shelter at the 2023 Census. Its later evidence indicated that number had increased further, although HUD could not reliably quantify by how much.
OECD — Economic Surveys: New Zealand 2026 Useful international context for the debt argument. New Zealand’s comparable debt target remains well below the OECD average, while the OECD also stresses the importance of maintaining fiscal buffers.
Treasury — 2022 Investment Statement Evidence that New Zealand’s infrastructure problems pre-dated the post-Covid migration surge: the report cited an estimated $104b historical infrastructure gap, including $21b associated with the existing housing shortage.